

Evidence-Carrying Anomaly Discovery
Machine learning can now rank every source in a telescope survey by how unusual it looks. A ranking is not a discovery. ECAD is a method for deciding when an unusual object can be claimed, with a stated error rate and an evidence trail anyone can check.
- Published
- 2 November 2026
- Version
- 1.1
- Type
- Methods paper, simulation study
- Department
- Apeiron, DoCA
- Licence
- CC BY 4.0
- Simulated sources
- 116,800
A ranking is not a discovery.
Euclid's first release alone covered about 30 million objects, and Rubin and Roman will add far more. A recent search scanned 99.6 million Hubble cutouts in two to three days and returned the ones that look strangest. What such searches cannot yet do is say how many of those are wrong, whether a flag reflects the sky or the instrument, or what another team would need to check the claim.
No error control
Searches report how many flagged objects experts later confirmed. None says in advance how many of its claims are expected to be wrong.
Artifacts are judged by eye
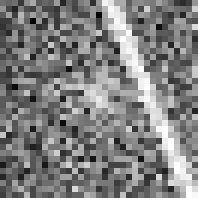
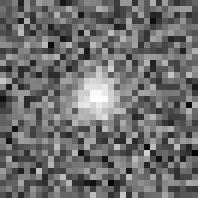
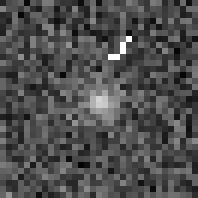
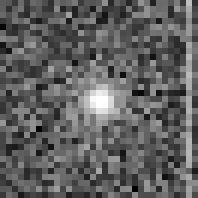
Cosmic rays, ghosts and satellite trails can look unusual. Nothing formally requires a candidate to appear in more than one independent exposure.
No evidence standard
A flag arrives as an image and a score. The provenance, calibration and review history another team would need to check the claim are rarely attached.
How ECAD decides.
ECAD sits on top of any anomaly score. It does not try to find stranger objects than other methods. It decides which flagged objects can be claimed, and with what evidence.
Per view
Per source
Unusual in at least two of three groups
Partial-conjunction test
Across the survey
- 01
Gate every view the same way
One data-quality rule, which never looks at the anomaly score, is applied identically to the reference population and to the sources being tested. A view that fails carries no evidence.
- 02
Compare like with like
Each view is scored and turned into a conformal p-value against reference views taken in the same observing conditions: same instrument, depth and image sharpness.
- 03
Require replication
A partial-conjunction test asks whether a source is unusual in at least two independent groups of observations. An artifact in one exposure cannot pass on its own.
- 04
Control false discoveries
The Benjamini-Hochberg procedure across all sources keeps the expected share of false claims below a level fixed in advance.
- 05
Separate known from unexplained
A class-conditional test checks each candidate against every known class, with a stated rate at which a known object is wrongly called new.
- 06
Attach the evidence
Every candidate carries a hashed, versioned bundle and one of five levels, from statistical flag (L0) to physically confirmed (L4).
Two conditions that bound any search like this.
To find objects that make up a fraction π of a survey, at a false discovery rate q, each reference stratum needs at least κ/(qπ) views, where κ is two for most sources. That is the resolution condition. It depends on how rare the objects are, not on how large the survey is.
The second condition is about purity. If anomalies make up a fraction ε of the reference itself, they sit in its extreme tail and hide the real ones. The search only works while ε stays below about qπ/κ. Unlike resolution, this cannot be fixed by adding data, and it rules out using a survey as its own reference.
The reference must be large enough to hold κ/(qπ) views, and clean enough to hold fewer than one contaminant among them.
A sky where the truth is known.
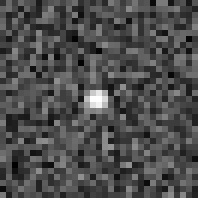
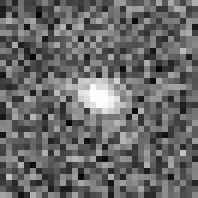
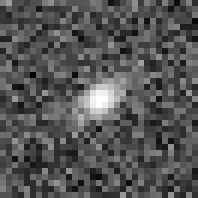
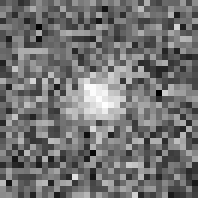
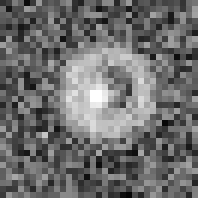
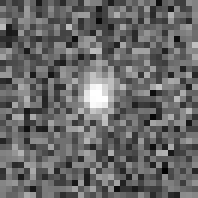
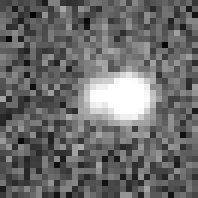
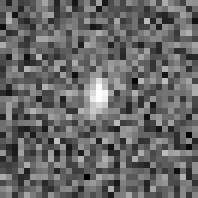
Before touching real data, we built a synthetic sky of 116,800 sources: disks, bulges, clumpy galaxies, stars and crowded fields, seen by two instruments in three independent groups of observations, under changing depth and image sharpness. Every exposure has a 2% chance of a cosmic ray, satellite trail, ghost, snowball or bad column. Into it we placed ring galaxies, strong lenses, mergers and an out-of-library class standing in for something genuinely new.
Typical sources
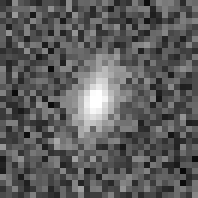
Disk
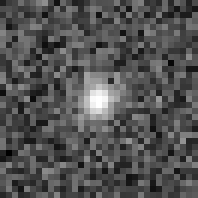
Bulge
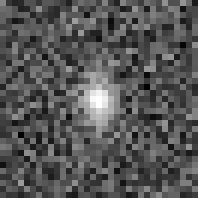
Bulge and disk
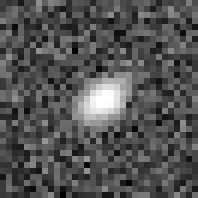
Clumpy disk
Star
Disk
Bulge and disk
Clumpy disk
Single-exposure artifacts
Ghost, visit 1
Same source, visit 2
Snowball, visit 1
Same source, visit 2
Satellite trail, visit 1
Same source, visit 2
Cosmic ray
Bad column
Injected anomalies
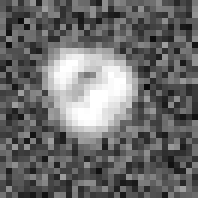
Ring galaxy
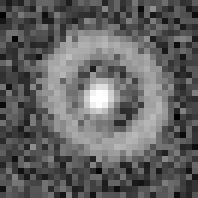
Ring galaxy
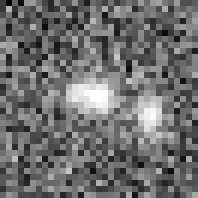
Strong lens
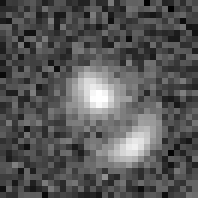
Strong lens
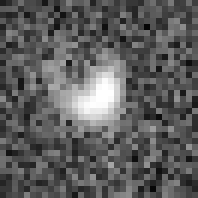
Merger, tidal tail
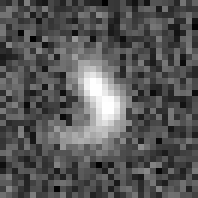
Merger, tidal tail
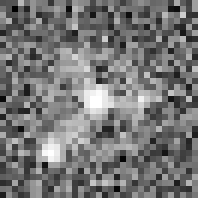
Out-of-library
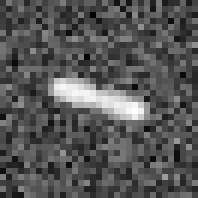
Out-of-library
Everything in this section is synthetic. It tests whether the statistics behave as claimed when their assumptions hold. It is not evidence about real astronomical objects.
What held.
- 1.5%
- False discoveries at L2, target 10%
- 0 in 200 runs
- Claims made with no anomalies present
- 0.03%
- Single-exposure artifacts reaching L2
- 95%
- Real anomalies in the top 100
False discoveries stay under control once replication is required
- v1.0, artifact-free reference
- v1.0, realistic reference
- v1.1
L1, unusual in at least one group
L2, unusual in at least two groups
› Show the numbers
| Configuration | Level | q = 5% | q = 10% | q = 20% |
|---|---|---|---|---|
| v1.0, artifact-free reference | L1 | 13.8% | 45.6% | 68.1% |
| v1.0, realistic reference | L1 | 0.4% | 7.1% | 15.8% |
| v1.1 | L1 | 2.4% | 7.2% | 16.5% |
| v1.0, artifact-free reference | L2 | 0.4% | 1.7% | 5.3% |
| v1.0, realistic reference | L2 | 0.0% | 0.7% | 1.8% |
| v1.1 | L2 | 0.5% | 1.5% | 3.0% |
Artifacts confined to one exposure almost never pass
- L1, one group
- L2, two groups
› Show the numbers
| Configuration | Reach L1 | Reach L2 |
|---|---|---|
| v1.0, artifact-free reference | 11.784% | 0.034% |
| v1.0, realistic reference | 0.495% | 0.021% |
| v1.1 | 0.331% | 0.029% |
Power depends on brightness, and replication costs some of it
- L1, one group
- L2, two groups
Ring galaxy
Strong lens
Merger
Out-of-library
› Show the numbers
| S/N (bin centre) | Ring galaxy L1 | Ring galaxy L2 | Strong lens L1 | Strong lens L2 | Merger L1 | Merger L2 | Out-of-library L1 | Out-of-library L2 |
|---|---|---|---|---|---|---|---|---|
| 20 | 0.00 | 0.00 | 0.00 | 0.00 | 0.00 | 0.00 | 0.00 | 0.00 |
| 33 | 0.00 | 0.00 | 0.00 | 0.00 | 0.00 | 0.00 | 0.00 | 0.00 |
| 56 | 0.00 | 0.00 | 0.00 | 0.00 | 0.01 | 0.00 | 0.04 | 0.00 |
| 94 | 0.02 | 0.00 | 0.00 | 0.00 | 0.03 | 0.00 | 0.15 | 0.03 |
| 159 | 0.14 | 0.02 | 0.01 | 0.00 | 0.20 | 0.06 | 0.23 | 0.12 |
| 269 | 0.41 | 0.11 | 0.06 | 0.01 | 0.41 | 0.19 | 0.54 | 0.30 |
| 455 | 0.69 | 0.45 | 0.24 | 0.06 | 0.68 | 0.44 | 0.78 | 0.56 |
| 769 | 0.91 | 0.78 | 0.52 | 0.25 | 0.81 | 0.66 | 0.94 | 0.77 |
Calibrating within observing conditions keeps p-values honest
- Pooled reference
- Stratified by observing conditions
- Nominal rate
› Show the numbers
| Tail | Nominal | Pooled reference | Stratified reference |
|---|---|---|---|
| p below 0.001 | 0.1% | 0.28% | 0.08% |
| p below 0.01 | 1% | 2.1% | 0.93% |
The resolution condition, tested
Scroll sideways to see every reference size.
› Show the numbers
| Prevalence | 250 | 500 | 1,000 | 2,000 | 4,000 | 8,000 | 16,000 | 30,000 |
|---|---|---|---|---|---|---|---|---|
| 0.3% | 0.00 | 0.00 | 0.00 | 0.00 | 0.00 | 0.00 | 0.00 | 0.00 |
| 1.0% | 0.00 | 0.00 | 0.00 | 0.00 | 0.00 | 0.00 | 0.01 | 0.01 |
| 2.9% | 0.00 | 0.00 | 0.00 | 0.00 | 0.05 | 0.10 | 0.15 | 0.15 |
| 9.1% | 0.00 | 0.00 | 0.13 | 0.27 | 0.30 | 0.30 | 0.30 | 0.31 |
What the reference contains matters as much as its size
- No gating
- Symmetric gating
- Contamination limit
Artifacts in the reference, L2 recall
Anomalies in the reference, L2 recall
› Show the numbers
| Reference population | L2 recall at q = 10% |
|---|---|
| Artifact-free reference | 0.185 |
| Realistic reference, no gating | 0.063 |
| Realistic reference, with gating | 0.155 |
| Gating, Bonferroni within groups | 0.149 |
| Anomalies at 0 of the reference | 0.184 |
| Anomalies at 0.01% of the reference | 0.189 |
| Anomalies at 0.03% of the reference | 0.154 |
| Anomalies at 0.1% of the reference | 0.052 |
| Anomalies at 0.3% of the reference | 0.001 |
| Anomalies at 1% of the reference | 0.000 |
Known objects stay known, and new ones are flagged
- Known classes
- Built to be new
- 5% target
› Show the numbers
| Class | v1.0 rule | v1.1 test |
|---|---|---|
| Ring galaxy | 0% | 5.1% |
| Strong lens | 0% | 3.9% |
| Merger | 0% | 5.3% |
| Out-of-library | 0% | 34.6% |
What an expert would actually review
- Single-view baselines
- ECAD
› Show the numbers
| Method | Real anomalies in the top 100 |
|---|---|
| Isolation forest, one view | 59.3% |
| Local outlier factor, one view | 63.4% |
| Same score, best single view | 87.7% |
| ECAD, L1 | 90.0% |
| ECAD, L2 | 94.8% |
What failed, and what we kept.
The simulation exposed three failures in the first version of the framework. Version 1.1 corrects all three.
The reference set was far too small
Version 1.0 asked for 1,000 reference views per stratum. That cannot resolve the prevalences real searches face. The new rule sizes the reference to the rarity of the objects sought.
Artifacts in the reference cost most of the power
With a realistic reference population, recall fell from 0.185 to 0.063. Symmetric data-quality gating restored it to 0.155 without loosening error control.
The rule for unexplained objects never fired
The original test called nothing unexplained, not even objects built to be new. The replacement flags 35% of them while keeping known classes near the intended 5%.
The pre-registered criteria, rehearsed
We ran the pass and fail criteria for the real-data study on the simulation. Two fail. We kept both thresholds unchanged and report the failures as they are.
| Criterion | Simulation outcome | Result |
|---|---|---|
| P1 False discovery rate | 0.5%, 1.5%, 3.0% at targets of 5, 10, 20% | Pass |
| P2 Artifact suppression | 0.03% reach L2, 91% fewer than L1 | Pass |
| P3 Power by class | Rings 0.51, mergers 0.50, new objects 0.59, lenses 0.12 | Fail for lenses |
| P5 Purity against ECAD-L1 | 94.8% against 90.0%, a gain of 4.8 points | Fail, needs 10 |
| P6 Calibration | No anti-conservative stratum in 50 runs | Pass, one-sided |
| P7 Known-class error | At most 5.3% at a 5% target | Pass |
What comes next.
The paper reports no astrophysical results. It fixes, in advance, the tests that would show ECAD fails on real archives, and commits to publishing those outcomes.
- 01
Register the protocol
The evaluation plan, its thresholds and the conditions for abandoning the approach are deposited with a timestamp before any real data are opened.
- 02
Build and audit the reference
Reference populations sized by the design rule, and a random audit of their purity, since that sets the rarest object the search can claim.
- 03
Run on public archives
Hubble, JWST (COSMOS-Web, JADES, CEERS), Euclid Q1 and Rubin Data Preview 1, with Roman added once its data are public.
- 04
Publish whichever way it goes
Every criterion, pass or fail, with full tables. Candidates are called unexplained only after two independent expert reviews.
What we release, and how to get the rest.
Released
- The full paper, openly licensed
- All figures and the numbers behind them
- The method, the two conditions and the protocol
Retained
- Simulation code and generator seeds
- The 116,800-source simulated catalogue
- Rendered sample cutouts
Available to researchers on request, and released openly with the confirmatory study.
Cite this work.
@misc{verma2026ecad,
  author    = {Verma, Shaurya},
  title     = {Evidence-Carrying Anomaly Discovery: Error-controlled,
               cross-instrument discovery of unusual objects in
               space telescope imaging},
  year      = {2026},
  version   = {1.1},
  publisher = {Zenodo},
  doi       = {10.5281/zenodo.23883469},
  url       = {https://doi.org/10.5281/zenodo.23883469}
}- Author
- Shaurya Verma
- Affiliation
- Apeiron, Department of Cosmology and Astrophysics, SHV Groups
- DOI
- 10.5281/zenodo.23883469
- Licence
- CC BY 4.0